F1 test wrap: Barcelona week one by the numbers
Here are the full times from all four days of F1 testing, plus statistical team-by-team and engine manufacturer analysis from the first week in Barcelona.

Photo by: XPB Images
Formula 1's first pre-season test came to a close on Thursday with Sebastian Vettel's best lap from Tuesday being the fastest of the week.
But it was clear that this first test was not about ultimate performance, and was more about system checks and endurance running – which is where world champion Mercedes focused much of its effort.
There were a few headline-grabbing times from various people though, with the overall order behind Vettel being dominated by those teams that had opted to bring some softer tyres.
And while Mercedes never tried for times with anything other than mediums, second fastest Nico Hulkenberg's overall position was on supersofts – ahead of ultrasoft runners Kimi Raikkonen and Daniel Ricciardo.
Here are the best times and tyres from the first Barcelona test:
|
Pos. |
Driver |
Team |
Day 1 |
Day 2 |
Day 3 |
Day 4 |
Laps |
Tyre |
|---|---|---|---|---|---|---|---|---|
| 1. |
|
Ferrari |
1.24.939 |
1.22.810 |
|
|
195 |
U-soft |
| 2. |
|
Force India |
|
|
1.23.110 |
|
99 |
S-soft |
| 3. |
|
Ferrari |
|
|
1.25.997 |
1:23.477 |
158 |
U-soft |
| 4. |
|
Red Bull |
1.26.044 |
1.23.525 |
|
|
199 |
U-soft |
| 5. |
|
Force India |
|
1.23.650 |
|
|
101 |
S-soft |
| 6. |
|
Red Bull |
|
|
1.26.497 |
1.24.293 |
170 |
U-soft |
| 7. |
|
Force India |
1.26.298 |
|
|
1.24.840 |
133 |
S-soft |
| 8. |
|
Mercedes |
|
1.24.867 |
1.26.084 |
1.26.212 |
332 |
Medium |
| 9. |
|
Sauber |
1.27.555 |
1.25.237 |
|
|
196 |
Soft |
| 10. |
|
Renault |
|
|
1.26.014 |
1.25.263 |
264 |
Soft |
| 11. |
|
Toro Rosso |
|
1.26.539 |
|
1.25.393 |
231 |
Medium |
| 12. |
|
Mercedes |
1.25.409 |
|
1.26.421 |
1.26.295 |
343 |
Medium |
| 13. |
|
Haas |
|
1.25.524 |
|
1.27.802 |
168 |
Soft |
| 14. |
|
Williams |
1.26.091 |
1.25.648 |
|
|
214 |
Soft |
| 15. |
|
Haas |
1.28.399 |
|
1.25.874 |
|
113 |
Soft |
| 16. |
|
Manor |
1.28.292 |
1.25.925 |
|
|
125 |
Soft |
| 17. |
|
Sauber |
|
|
1.26.392 |
1.26.053 |
236 |
Soft |
| 18. |
|
McLaren |
|
1.26.082 |
|
no time |
122 |
Soft |
| 19. |
|
Renault |
1.29.356 |
1.26.189 |
|
|
79 |
Soft |
| 20. |
|
Toro Rosso |
1.27.180 |
|
1.26.239 |
|
216 |
Medium |
| 21. |
|
Williams |
|
|
1.26.712 |
1.26.483 |
163 |
Soft |
| 22. |
|
McLaren |
1.26.735 |
|
1.26.919 |
|
135 |
Soft |
| 23. |
|
Manor |
|
|
1.28.249 |
1.28.266 |
129 |
Soft |
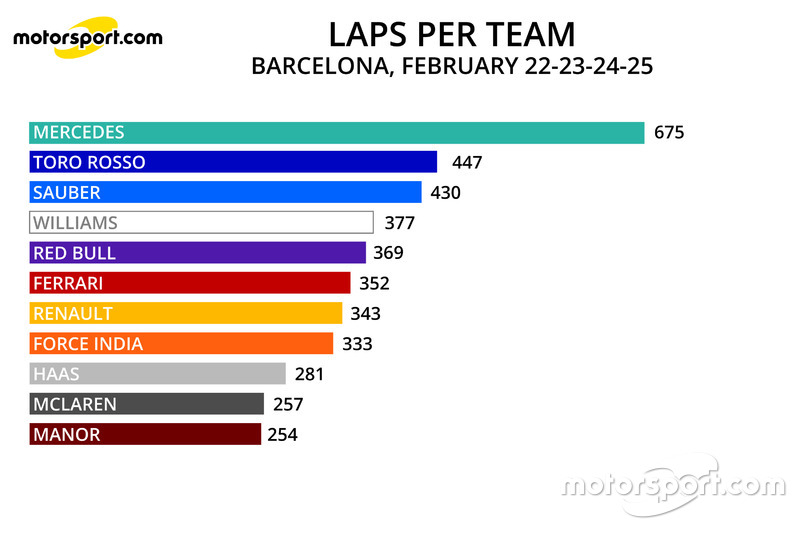
Racking up the miles
Here’s a look at the lap count sorted by team – with Mercedes completing just over 10 race distances, logging almost double the mileage of main rival Ferrari, and McLaren trailing every other team bar Manor:
Honda's mighty deficit
Things look even gloomier for McLaren when the engine manufacturers’ kilometers are compared, with Honda lagging badly behind the rest, even when the fact it only powers one team is taken into account:

Be part of Motorsport community
Join the conversationShare Or Save This Story


Ferrari announces HP as new F1 team title sponsor

Ferrari "made too many mistakes" for F1 podium fight at Chinese GP

What's been going wrong for Leclerc in F1's tiny margins qualifying game

Ferrari announces HP as new F1 team title sponsor

Raul Fernandez set to get 2024 Aprilia MotoGP bike at Jerez

Ford simulator boosting M-Sport WRC Puma performances

Mooted F1 points system like "putting a plaster on a big cut" - Ocon

How Stroll and Magnussen revealed the scale of F1’s racing and rules problems

Did F1's new sprint format work?

Chinese Grand Prix Driver Ratings 2024

Why Verstappen's China F1 win was a sideshow to the real battle
Subscribe and access Motorsport.com with your ad-blocker.
From Formula 1 to MotoGP we report straight from the paddock because we love our sport, just like you. In order to keep delivering our expert journalism, our website uses advertising. Still, we want to give you the opportunity to enjoy an ad-free and tracker-free website and to continue using your adblocker.


Top Comments